Welcome,
What is an inverted yield curve
Should we be concerned?
My dear Friends,
over the past weeks, there has been a lot of talk about government bonds having an inverted yield curve. This news comes with parlays about this being very bad, worrisome and a clear sign that a recession is looming.
However, before we all succumb to panic mode, we should first find out what this inverted yield curve is all about and why some financial experts are so concerned.
Most importantly, should we be concerned?
What are bonds
Generally, a bond is a loan from an investor to a borrower such as a company or government. The borrower uses the money to fund its operations, and the investor receives interest for lending the money. Like stocks, the market value of a bond can change over time.
Bonds are fixed-income instruments and one of a portfolio’s three main asset classes. In other words, a certain amount of bonds should always be included in a diversified portfolio.
Types of bonds
Bonds, like other investments, balance risk and reward. Typically, bonds that are lower risk pay lower interest rates; riskier bonds pay higher rates in exchange for the investor giving up some safety.
Government Bonds
National governments and the public sector issue government bonds to finance their expenditures. These bonds are backed by governments and are considered a safe investment. This, though, largely depends on the trustworthiness of the issuing government.
Like any other financial product, Government bonds are rated to inform investors how safe their investment is. However, the flip side of these bonds is that they usually pay low-interest rates(yield). There are usually several types of bonds governments can issue. Usually, they differ based on the length of time till maturity.
Corporate Bonds
Companies can issue corporate bonds when they need to raise money. A little bit like selling stocks. But unlike stocks, bonds don’t give you ownership rights. They represent a loan from the buyer (investor) to the bond issuer(company).
Usually, companies issue bonds if they, for example, want to build a new plant. Then the company issues a bond with a fixed maturity date. In short, the period the company needs the investor’s money to complete the project successfully. Once the investor has bought the bond, she/he will receive interest for the amount the investor has “lent” to the company. At the end of the “loan period”-the maturity-the company will pay back the amount it “borrowed”.
As with government bonds, bonds can be either high-yield or investment grade. A company usually issues a high-yield bond with a higher risk of default. Yet, companies who issue investment-grade bonds usually have a higher credit rating/lower risk of defaulting and, therefore, only need to pay lower interest rates.
The yield curve
Many think all rates behave in the same way. The reality, however, is much more complex, with rates on various bonds often behaving quite differently depending on their maturity. A yield curve is a way to visualize this difference easily; it’s a graphical representation of the yields available for bonds of equal credit quality and different maturity dates.
A yield curve is a way to measure bond investors’ feelings about risk and can have a tremendous impact on the returns they receive on their investments. For those who understand how it works and how to interpret it, a yield curve can even be used to help track the direction of the economy.
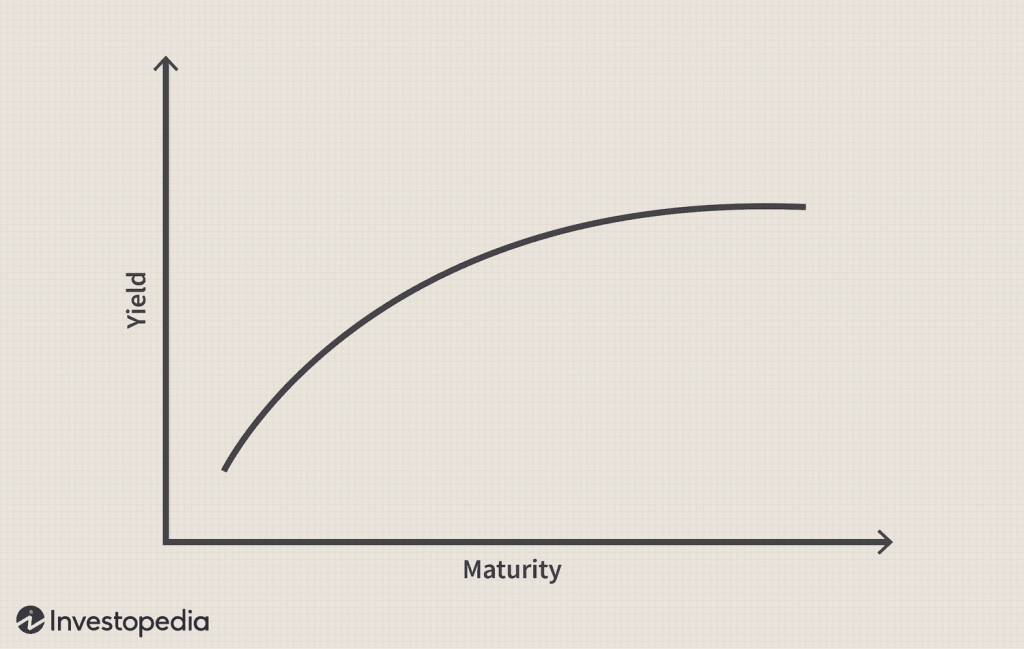
The normal yield curve
In general, short-term bonds carry lower yields, reflecting that an investor’s money is at less risk. The thinking behind this is that the longer investors commit funds, the more an investor should be rewarded for that commitment or the risk she/he takes that the borrower may not pay them back.
This is reflected in the normal yield curve, which slopes upward from left to right on the graph as maturities lengthen and yields rise. You’ll generally see this type of yield curve when bond investors expect the economy to grow at a normal pace without significant changes in the rate of inflation or major interruptions in available credit.
The steep curve
A steep yield curve is generally found at the beginning of a period of economic expansion. At that point, economic stagnation will have depressed short-term interest rates. But as the economy begins to grow again, one of the first signs of recovery is an increased demand for capital, which many believe leads to inflation. At this point in the economic cycle, long-term bond investors fear being locked into low rates, which could erode future buying power if inflation sets in. As a result, they demand greater compensation—in the form of higher rates—for their long-term commitment.
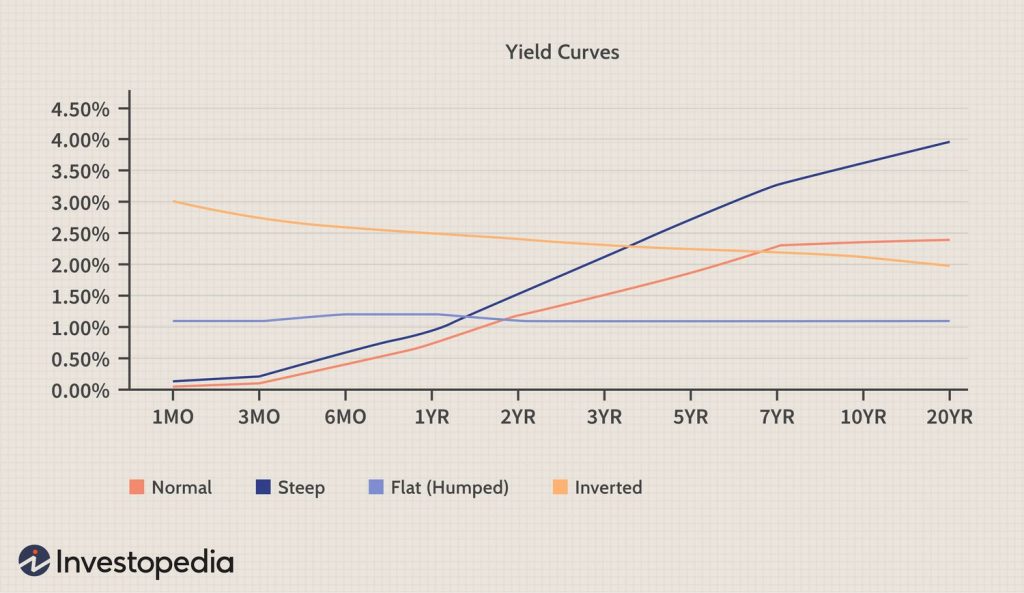
Inverted yield curve
At first glance, an inverted yield curve seems counterintuitive. Why would long-term investors settle for lower rewards than short-term investors, who take far less risk? This happens when there is a surge in demand for long-term Government bonds (e.g. 10-year US Treasury bond). As the demand for longer-term bonds increases, the prices for these bonds also increases. As yields have an inverse relationship with bond prices, the yield falls as the price increases. Also, as investors shift their money to longer-term bonds by selling their holdings of shorter-term bonds, the price of short-term bonds falls, and their yields rise. This results in an inverted yield curve. An inverted yield curve is often taken as a sign that the economy may soon stagnate.
Flat or humped curve
Before a yield curve can become inverted, it must first pass through a period where short-term rates rise to the point where they are almost the same as long-term rates. When this happens, the curve’s shape will appear flat or, more commonly, slightly elevated in the middle.
It is important to note that not all flat or humped curves turn into fully inverted curves; however, investors shouldn’t ignore a flat or humped curve. Historically, economic slowdown and lower interest rates follow a period of flattening yields.
Reading a yield curve
The yield curve is a graphical representation of the interest rates on debt for a range of maturities. It shows the yield an investor expects to earn if he lends his money for a given period. The graph displays a bond’s yield on the vertical axis and the time to maturity across the horizontal axis. The curve may take different shapes during different economic cycles. In an ideal world, it is upward-sloping.
An Analyst, wealth manager or investor may use the yield curve as a leading economic indicator, especially when it shifts to an inverted shape, which signals an economic downturn. This means long-term returns are lower than short-term returns.
Tell tales of a curve
- Forecasting interest rates: The shape of the curve helps investors get a sense of the likely future course of interest rates. A normal upward-sloping curve means that long-term securities have a higher yield, whereas an inverted curve shows short-term securities have a higher yield.
- Forecasting the banking business: Banks and other financial intermediaries borrow most of their funds by selling short-term deposits and lending by using long-term loans. The steeper the upward-sloping curve is, the wider the difference between lending and borrowing rates and the higher their profit. On the other hand, a flat or downward-sloping curve typically translates to a decrease in the profits of financial intermediaries.
- Forecasting economic developments: A “normal” curve is an indicator of a growing economy an inverted curve, however, indicates an economic downturn.
The influencing factors
- Inflation: Central banks tend to respond to a rise in expected inflation with an increase in interest rates. A rise in inflation leads to a decrease in purchasing power; therefore, investors expect an increase in the short-term interest rate.
- Economic growth: Strong economic growth may increase inflation due to a demand increase. Strong economic growth also means more competition for capital, with more investment options for investors. Thus, strong economic growth leads to an increase in yields and a steeper curve.
- Interest rates: If a central bank raises interest rates on government bonds, the result usually is a higher demand for government bonds. This will eventually lead to a decrease in interest rates.
The concern
As explained, the shape of the Treasury yield curve can help determine an economy’s current and future strength. The US government bond or Treasury yield curve occupies a special place compared to all other yield curves as it is generally regarded as the “benchmark curve” for the US and global economies.
For example, yields on government bonds and other securities are generally among the lowest because of a government’s full faith and credit to back them. This allows bond investors to compare the government yield curve with riskier assets, such as the yield curve of A-rated corporate bonds. The yield difference between the two is called the “spread.” The closer the yields are together, the more confident investors are in taking the risk in a bond that is not government-backed. The spread generally widens during recessions and contracts during recoveries.
What has happened
The huge sell-off in Wall Street due to rising interest rates caused a surge in demand for longer-term bonds, a clear signal for increased risk aversion amongst investors. As a result, the bond yield curve inverted-longterm bonds became more expensive; however, its yield went down.
This shows that investors are worried about a possible recession and want to lock-in long term US Government bond yields, which is considered a safe asset class.
History shows that yield curve inversions have preceded every recession in the US in the last 40 years or so.
Should investors be concerned
In an increasingly globalized world, fears of a recession in the world’s largest economy are a cause of concern. However, the economic data coming out of the US is quite strong. US unemployment is the lowest in the last 50 years, and the economy is robust. Investors should also know that yield curve inversions have not always led to full-fledged recessions; sometimes, they simply led to an economic slowdown.
The impact of an economic slowdown across different asset classes is usually less severe than that of a recession. Historically, slowdowns preceded recessions, but slowdowns have not always led to recessions.
So it is best not to be too concerned because downturns usually do not last forever. Unwarranted risk aversion, however, may lead to sub-optimal returns and compromise the long-term financial interests of investors.
Buzz
An inverted yield curve happens when a demand surge for long-term Government bonds occurs. Consequently, the bond price increases, but yields fall. As investors sell their holdings of shorter-term bonds, the price of short-term bonds falls, and their yields rise.
The yield curve may take different shapes during different economic cycles. In an ideal world, it is upward-sloping. An inverted shape signals an economic downturn.
Yield curve inversions have not always led to full-fledged recessions; sometimes, they simply led to an economic slowdown.
Investors should not be overly concerned or overreact, as economic slowdowns do happen at regular intervals and never last forever.


